Breaking

Search This Blog

Showing posts with label Report. Show all posts

19/05/2025

Household Survey on Impact of Economic Crisis - 2023 Sri Lanka  Final Report
May 19, 2025

Household Survey on Impact of Economic Crisis - 2023 Sri Lanka Final Report


Final Report of Household Survey on Impact of Economic Crisis - 2023 Sri Lanka has been released.

Key Findings

  • 54.9% of individuals (age 3-21) schooling has been affected.
  • 15.1% of individuals involved in economic activities have been affected by job losses (main and/or secondary).
  • 23.1% of patients have changed their main treatment method.
  • 22.0% of households have indebted.
  • 51.0% of income earners who did primary jobs experienced a decrease in their income.
  • 60.5% of households have experienced a decrease in their average monthly household income.
  • 91.1% households experienced an increase in their average monthly household expenditure.

Contents of the Report

1. Introduction.

2. Survey Methodology & Estimation Procedure.

3. Education.

4. Employment.

5. Health

6. Household Income

7. Household Expenditure.

8. Impact of Economic crisis on Household income, Expenditure, and Coping strategies

9. Indebtedness.

10. Food Security.

Click Below for the PDF

Household Survey on Impact of Economic Crisis - 2023 Sri Lanka

26/04/2025

Basic Statistics on GCE A/L 2024 Results
April 26, 2025

Basic Statistics on GCE A/L 2024 Results


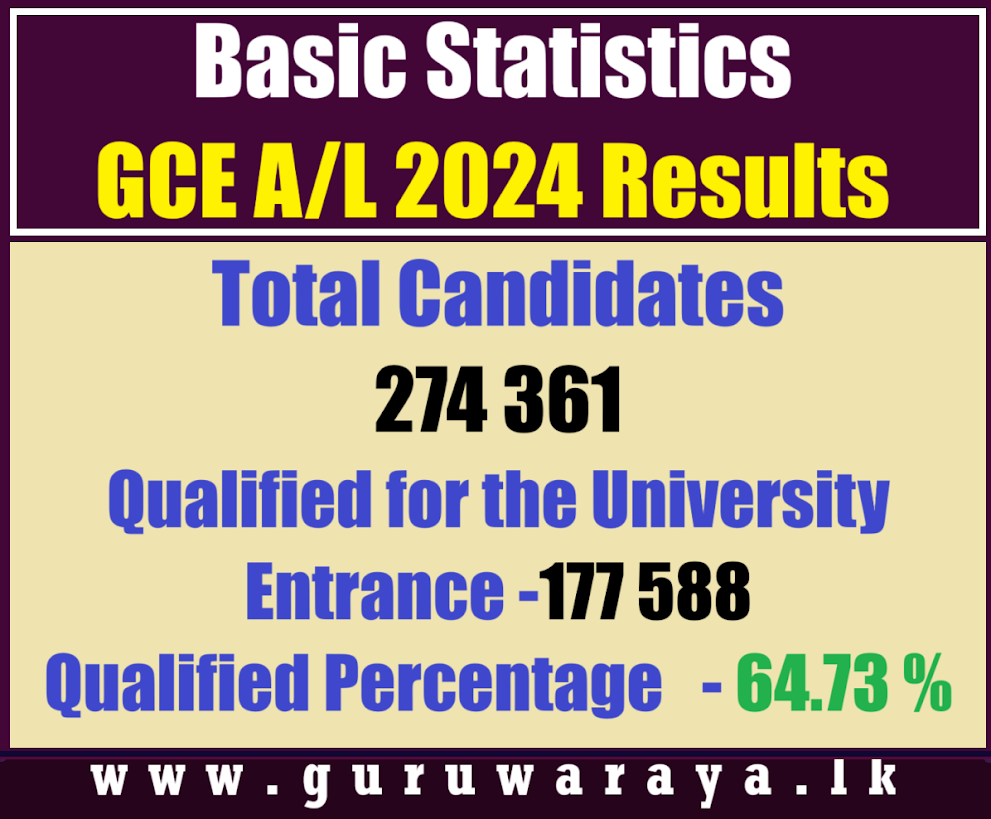
Department of Examination has released the Basic Statistics of the Results GCE A/L 2024 Students.


Total Candidates
274 361

School Candidates
222 774

Private Candidates
51 587

Qualified for the university Entrance
Total
177 588


School Candidates
149 964


Private Candidates
27 624

Percentage of University Entrance Qualification - 64.73 %


Census of Public and Semi Government Sector Employment - 2024 (2025 Report)
April 26, 2025

Census of Public and Semi Government Sector Employment - 2024 (2025 Report)


Total Employees - 1 156 018
Male - 583 363
Female - 572 655

Central Government  
Public Sector - 475 483
Semi Government Sector  - 213 186

Provincial Government
Public Sector - 463 280
Semi Government Sector - 4069


The Census of Public and Semi Government Sector Employment 2024 is the ninth in a series of such censuses conducted by the Department of Census and Statistics (DCS). The first scientific census on public and semi government sector employment was carried out in 1980 in order to cater to the requirements of data on the public and semi government sector for planning and monitoring purposes involving government employees and the institutions in which they work. Subsequently, six censuses were carried out in 1985, 1990, 1994, 1998, 2002 and 2006 respectively at a frequency of every 4 to 5 years, and the eighth census was conducted 10 years later in 2016. Due to the country's unstable situation caused by the COVID-19 pandemic and economic crisis, the ninth Census of Public and Semi-Government Sector Employment, originally scheduled for 2020, was delayed until 2024.


This report presents preliminary findings of the Census of Public and Semi Government Sector Employment 2024. These findings are based on the institutional level summaries prepared manually after the census in order to give a snapshot of the extensive exercise. Questionnaires completed by the institutions are now being processed and the final report will be released afterwards.

Listing of Public and Semi Government Institutions 
Census units were categorized into four major groups as follows; 
● Line Ministries 
● Provincial Councils 
● District Secretariats 
● Institutions of the Central Government that do not come under a Line Ministry


for Full Detailed Report, Click Below


07/04/2025

Census Report - Population of Sri Lanka
April 07, 2025

Census Report - Population of Sri Lanka


POPULATION OF SRI LANKA BY DISTRICT EXECUTIVE SUMMARY 
  • The enumeration stage of the Census of Population and Housing 2024, the 15th census in Sri Lanka's series of censuses, was conducted from October 2024 to the second week of February 2025. The census moment was 00:00 hours on 19th December 2024. 
  • According to this census, the population of Sri Lanka was recorded as 21,763,170. 
  • This census has shown an increase of 1,403,731 compared to the population reported in the Census of Population and Housing 2012. 
  • During the 2001-2012 inter-census period, the average annual population growth rate was 0.7 percent. For the 2012-2024 inter-census period, the average annual population growth rate is 0.5 percent. This indicates that while the population growth rate in Sri Lanka has slowed, the population continues to increase. 
  • When considering the population by province in Sri Lanka, the Western Province has the highest population, accounting for 28.1 percent of the total, while the Northern Province has the lowest, with 5.3 percent of the total population. 
  • When considering the population distribution at the district level, Gampaha District has reported the highest population, with 2,433,685 persons. Colombo District follows, with a population of 2,374,461. Together, only these two districts have a population of over 2 million. 
  • Apart from Gampaha and Colombo districts, the highest population is reported from Kurunegala (1,760,829), Kandy (1,461,269), Kalutara (1,305,552), Ratnapura (1,145,138), and Galle (1,096,585) districts respectively, with each of these districts reporting a population of more than one million. 
  • As in the previous censuses, districts with the lowest population in the country this time are Mullaitivu (122,542), Mannar (123,674), Kilinochchi (136,434) and Vavuniya (172,257) districts in the Northern Province. 
  • The highest annual growth rate of 2.23 percent has been reported from Mullaitivu district. The lowest annual growth rate is recorded in Vavuniya District (0.01 percent). 
  • As in previous censuses, the highest population density of 3,549 persons per square kilometer is reported in Colombo District, while the lowest population density is reported in Mullaitivu District, which has a population density of 50 persons per square kilometer.

Click Below for the Report in Sinhala, Tamil and English

26/03/2025

University Statistics Report - 2023
March 26, 2025

University Statistics Report - 2023


The latest statistics on Sri Lankan universities have been released. The University Entrance Reports are based on student registrations up to and including the 2022 Advanced Level examination cohort.

No of Universities - 17
No of Faculties - 121
No of Departments - 766
No of Institutes - 18

2022 A/L - 2022/2023 Academic Year


Arts Admitted
Boys -  1968
Girls - 11087

Commerce - Admitted
Boys -  2584
Girls - 5417

Physical Science - Admitted
Boys -  5175
Girls - 3029
 
Biological Science - Admitted
Boys -  2706
Girls - 7398

Engineering Technology  - Admitted
Boys -  1952
Girls - 381

Bio System Technology  - Admitted
Boys -  337
Girls - 1216


You can get More Statistics Below. Click The Topic to Download the PDF

1. General Information Statistics Report 
2. University Admission Statistics Report 

3. Student Enrolment Statistics Report 

4. Graduate Output Statistics Report 

5. Staff  Statistics Report 

6 .Finance Statistics Report 

7. Welfare Facilities  Statistics Report 


19/03/2025

School-Based Student Health Survey Report
March 19, 2025

School-Based Student Health Survey Report


The School-Based Student Health Survey Report has been released. We have attached the key data for reference.

Teachers and parents are strongly encouraged to read this report, especially the Conclusion and Recommendations sections.


We have attached the key data for reference Below

Diet and nutritional status at a glance Percentage of students (13-17 years old) who:
  • Reported going hungry - 4.3%
  • Did not eat any fruit during past 7 days -  24.9%
  • Did not eat any vegetable during past 7 days  - 3.1%
  • Took carbonated drinks 1 or more times per day -  17.4%
  • Took food from local roadside restaurants, boutiques, Choon paan or fast-food restaurants one or more times a week - 70.4%

Physical activity at a glance Percentage of students (13-17 years old) who:

  • Were physically active for at least 60 min/day on all 7 days - 11.9%
  • Spent 3 or more hours/day doing sitting activities - 43.9%
  • Did not walk or ride a bike to school - 42.5%
  • Did not attend physical education classes - 49.4%

Hygiene at a glance Percentage of students (13-17 years old) who:
  • Washed hand under running water before eating - 68.9%
  • Most of the time or always washed hands after using toilets /latrines - 70.3%


Oral hygiene at a glance Percentage of students (13-17 years old) who: 
  • Clean or brush teeth 1 or more times/day 95.0% 
  • Missed school due to a dental problem 6.6%

Mental Health at a glance Percentage of students (13-17 years old) who: 
  • Felt lonely 22.4% 
  • Felt always worried and could not sleep 11.9% 
  • Attempted suicide 9.1% 
  • Had no close friends 7.5% 
  • Felt depressed 18.0%

Tobacco use at a glance Percentage of students (13-17 years old) who: 
  • Currently use any tobacco product 9.7% 
  • Currently smoke cigarettes 5.7% 
  • Currently use smokeless tobacco 7.3% 
  • Currently use electronic cigarettes 5.0% 
  • Tried cigarette before age 14, among who ever smoked cigarettes 34.7%

Alcohol use at a glance Percentage of students (13-17 years old) who: 
  • Currently use alcohol in preceding 30 days 5.3% 
  • First drank alcohol before age 14, among who ever had a drink of alcohol 39.3%

Substance use at a glance Percentage of students (13-17 years old) who
  • Currently use cannabis 2.1% 
  • Have ever used Amphetamines or Methamphetamines for non-medical purposes 1.5% 
  • Tried addictive substance before age 14, among who ever used drugs 47.7%

Violence and injury at a glance Percentage of students (13-17 years old) who: 
  • Who were physically attacked 23.8% 
  • Were in a physical fight 34.5% 
  • Were seriously injured 45.8% 
  • Most serious injury was a motor vehicle accident 12.7%

Sexual health at a glance Percentage of students (13-17 years old) who:

  • Have ever heard about HIV infection / AIDS 63.0%
  • Have been taught ho to avoid HIV Infection / AIDS 44.2%
  • Have been taught how to avoid geting pregnant 42.9%
  • Have has sexual relationship - 4.9%
Parental engagement at a glance Percentage of students (13-17 years old) who: 
  • Parents/guardians knew what they were doing with their free time 61.0% 
  • Parents/guardians understood their problems 44.5%
  • Parents/guardians checked their homework 57.1%
  • Parents/guardians never or rarely went through their things without approval 14.2%
Click Below for More Details


13/02/2025

Students Performance  in Grade V Scholarship Exam 2024
February 13, 2025

Students Performance in Grade V Scholarship Exam 2024


No of Sat 
 -319, 284

Obtained marks 70 or above (35 or above for each paper) 
- 77.96 %

Obtained marks 100 or above (50 or above for each paper) - 37.70 %

Equal or above the Cut-Off (Qualified to receive bursaries and apply for schools) 
- 16.05%

Mean of Marks 
- 107.25

Standard Deviation of Marks 
- 30.88

Common Cut Off 
- Sinhala Medium 143
- Tamil Medium 141

Click Below for Full Details

Students Performance  in Grade V Scholarship Exam 2024  

22/10/2024

GCE O/L 2023 - Performance Report
October 22, 2024

GCE O/L 2023 - Performance Report

Performance Report of GCE O/L 2023 Exam has been Released by Department of Examinations.

Qualified for A/L - 75.72
9 A - 13 513
All W - 7967

Top Performers - Province
  1. Southern
  2. EAStern
  3. Western
  4. Sabragamuwa
  5. Central
  6. Uva
  7. North Western
  8. Northern
  9. North Central

Top Performers _Districts
  1. Ampara
  2. Matara
  3. Colombo
  4. Batticaloa
  5. Hambanthota
  6. Kandy
  7. Kegalle
  8. Galle
  9. Ratnapura
  10. Mannar
  11. Gampaha
  12. Kurunagala
  13. Badulla
  14. Kalutara
  15. Matale
  16. Anuradhapura
  17. Monaragala
  18. Jaffna
  19. Nuwareliya
  20. Puttalam
  21. Mullaiteewu
  22. Kilinochchi
  23. Vavuniya
  24. Trincomalee
  25. Polannaruwa


Click Below for the Performance Report

28/08/2024

School Census Report - 2023

25/07/2023

Annual Performance Report 2022 - Pension Department

Popular

Recent

Ad

Learning Materials for Students